GET IN TOUCH
- Please wait...

Bangladesh has always been heavily dependent on fish as a primary source of protein for its people. This has remained the case for years due to the low per capita income of the country and the inability of its citizens to accommodate higher value proteins into their diets. Moreover, the demand for fish has always been followed closely by supply, although there still remains a shortfall of 1 mn Tonnes to this day.
There is considerable scope for expansion of supply as Bangladesh is a riverine country, which in the 1970s had 800 rivers running through its core with a total length of 24,140 km. Bangladesh has round 57 trans-boundary rivers coming down to it of which 54 are from India and 3 from Myanmar. If these natural water bodies are leveraged properly then Bangladesh has a scope to become a net producer of fish.
In terms of GDP, the sector comprised of 23% of agricultural in 2012. However, its importance is further magnified because it can be argued that the sustained GDP growth rate of 6% over the years and a current base of USD 123 bn has been fed by the produce from the fisheries sector. This is because protein is what leads to a productive workforce regardless of sector and a cheap source of this nutrient is especially important for an LDC such as Bangladesh.
In addition, due to the rural bias of Bangladesh in terms of population, around 11% of the total population is engaged in the supply side of the fisheries sector in one way or another. The contribution of this sector has been growing steadily over the last ten years with average growth rate estimated to be around 5.5% over that period in terms of production. Fish production in Bangladesh stood at 3.26 mn tonnes in 2011-12 (FSYB, 2011-12), up from 2.56 mn tonnes in the FY 2008.
A 2010 study found that consumption pattern of fish in rural areas consisted mainly of low value wild fish and carps while the basket in the urban areas consisted of a combination of Pangas, Tilapia, Climbing perch (Koi) among others. The principal reason behind basic rural consumption of fish is a failure of the market mechanism to clear supply and demand properly. This may arise because cultivated fish is used for own consumption and selling to markets.
If there is over or underproduction, fish farmers may change their allocation between the above mentioned categories, hence leading to insufficient intake of fish by them at times and wastage in others. Market linkages should be beefed up in order to mitigate this problem by allowing proper flow of information among participants throughout the value chain from the fish farmer to the retailer.
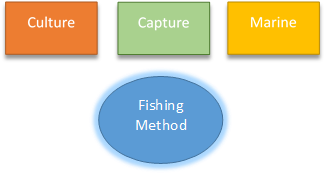
Fish cultivation can be put into three broad categories as follows.

Aquaculture
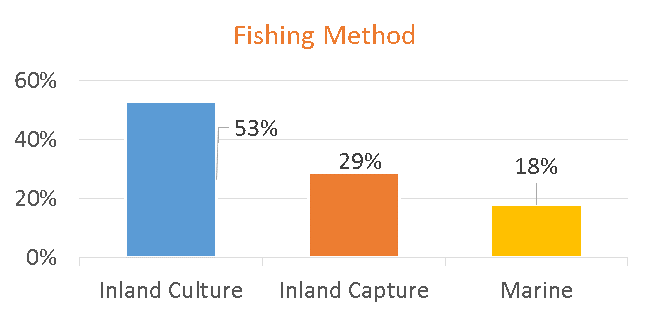
It is the method where rural households and entrepreneurs culture fish for their own diet as well as for selling. This can be further separated into three categories being homestead, entrepreneurial and intensive pellet fed systems. Overall, 53% of the fishing method is comprised of aquaculture.
Capture
Capture consists of 30% of the fish production in 2011-2012. Decrease in its ratio in the fishing method over the years shows a shift towards a more organized way of cultivating fish through a development in the supply chain of fishing industries.
Marine
This category of the fishing method comprises of 18% of the total production volume with a production of 578,620 MT in 2011-12. Production in areas like Saint Martin and Sundarbans is not possible as these are marked as ecologically sensitive that adversely affect fishing activity. However, new opportunities are emerging after the sea boundary ruling in favor of Bangladesh which has opened up 19,467 sq km for Bangladesh to explore.
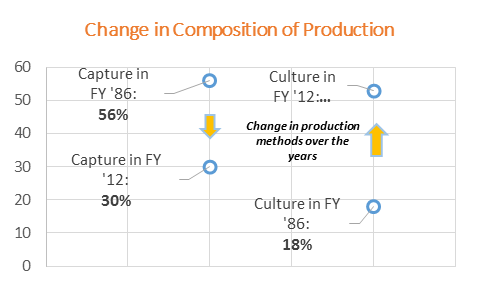
 The composition of fishing method has changed over time in Bangladesh. Namely, there has been a stark switching of priority between the capture and culture categories with culture taking the lead in recent years.
This transition points to a move to a more organized regime in fishing and profit seeking motives by the farmers. In the period 1985-86 for instance, the capture category of fish supply consisted of 56% of the total production whereas in 2011-12, it only consisted of 30% with the culture category making up 53% of production. In addition, this points to opportunities for market interventions which would enhance the production volume in the culture category of fishing and increase its share from the current rate of around 55% of fishing production.
The chart illustrates the transition of Bangladeshi fishing concentration from the catching category to the culture category.

The fish they produce increasingly go forward in the value chain in the form of value added products such as processed fish. These products are in turn sold in urban retailing outlets or exported. There are around 160 processing plants in Bangladesh and most of them are concentrated in the Southern parts of the country namely, Khulna, Satkhira, Barisal, Chittagong and Cox’s Bazar. These plants have a combined capacity of producing 350,000 MT of processed fish per year.
This capacity is going to be put under strain as the processed fish sector is going to experience progressively faster demand with increased levels of urbanization (growth of 4%/year) and changing employment and socio-economic profile of Bangladesh. With the rising popularity of retail outlets such as Agora, Meena Bazar, Nandan, Swapno and the move to a more processed style of eating in the urban areas, domestic demand for processed fish is projected to be robust in the coming years.
With fish demand projected to reach over 4.5 MT by 2021, it is of the utmost importance that market linkages be strengthened by considering the perspectives of all value chain participants. Through this, it can be ensured that the supply shortfall of fish currently experienced in the country can be turned around to a surplus and that the rural population which consists of more than half of the total can have sufficient nutrients in their diet to ensure overall growth of capital; human and physical.
Do you want consumer/market data on your preferred sector? Please fill out the form and we’ll get back: https://docs.google.com/a/lightcastlebd.com/forms/d/1sl-IcBYHc7BXTWOgXK-LL_DU8BkTS73cXEdyaRF4rTo/formResponse
Our experts can help you solve your unique challenges
Stay up-to-date with our Thought Leadership and Insights