



GET IN TOUCH
- Please wait...

“What gets measured gets managed.” Peter Drucker’s line was never written about carbon, but it might as well have been. Every factory floor, every shipment, every kilowatt drawn from the grid now carries a number. Lenders price it into credit risk; Buyers embed it` in supplier scorecards; Regulators are converting voluntary disclosure into mandatory, sector-specific reporting.
For Bangladesh, this is not a distant trend anymore. Ready Made Garments exporters already face buyer scorecards from Inditex, H&M, and other EU-linked brands that weigh Scope 3 supply chain emissions in sourcing decisions. The EU’s Carbon Border Adjustment Mechanism will hit export competitiveness on carbon-intensive inputs directly. Bangladesh’s LDC graduation will remove the trade preferences that have cushioned exporters from this so far. Scope 1 and 2 measurements are becoming a baseline compliance cost. Scope 3, the hardest to measure, is exactly where buyer pressure sits.
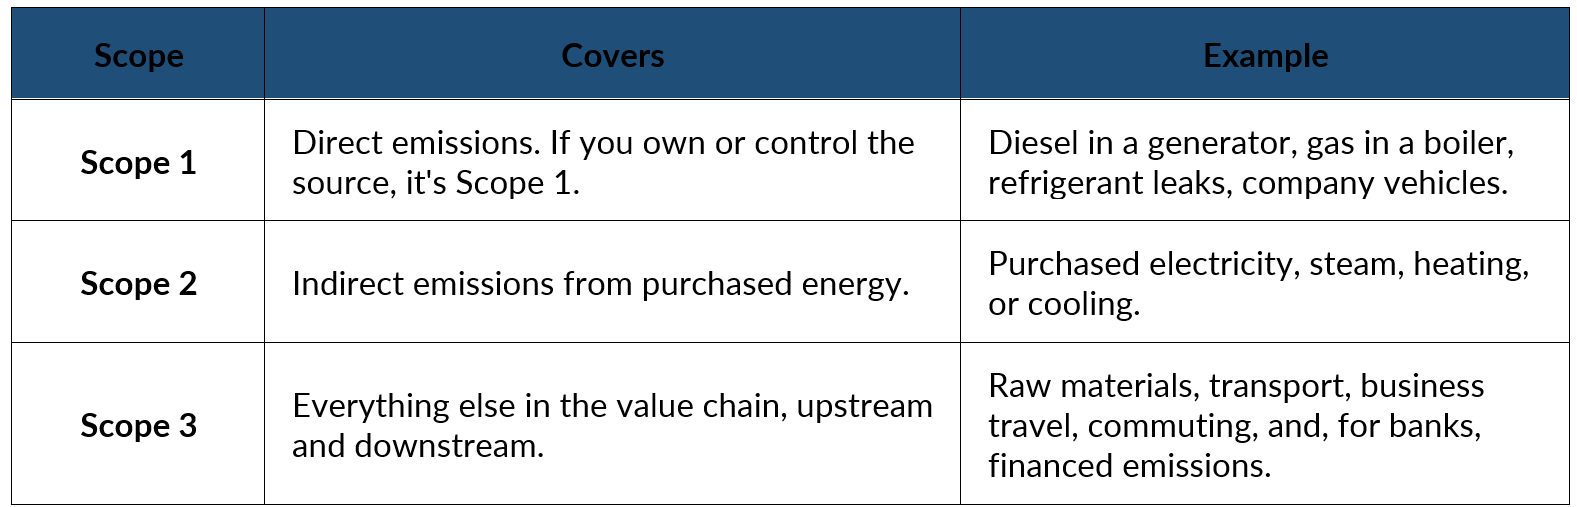
For a manufacturer, Scope 1 and 2 are usually simple: fuel receipts and electricity bills. For a bank, Scope 3 is the entire loan book.
Before Scope 1, 2, and 3, organizations reported emissions on their own terms. One company’s “total emissions” excluded purchased electricity. Another’s excluded the entire value chain. Comparison across companies was close to meaningless.
The Greenhouse Gas Protocol was formally published in 2001, built jointly by the World Resources Institute (WRI) and the World Business Council for Sustainable Development. The partnership behind it started in 1998.1 By 2016, 92 percent of Fortune 500 companies reporting to the Carbon Disclosure Project (CDP) used the Green House Gas (GHG) Protocol, directly or through a program built on it.2 That’s why every later framework, GRI, TCFD, IFRS S1 and S2, builds on this methodology instead of inventing a new one.
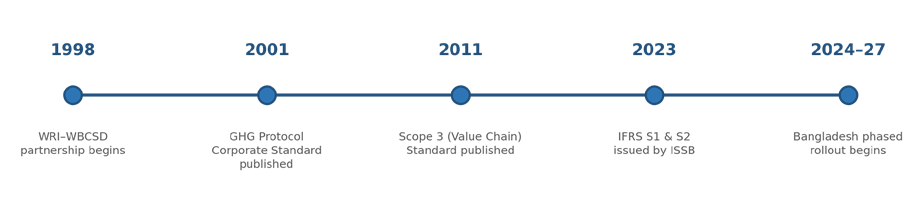
Figure 1: The 25-year path from a voluntary industry partnership to mandatory disclosure in Bangladesh
Scope 3 came much later. Its standard wasn’t published until 2011, a full decade after Scope 1 and 2.3
The GHG Protocol reduces broad organizational activity to one comparable figure in four steps.
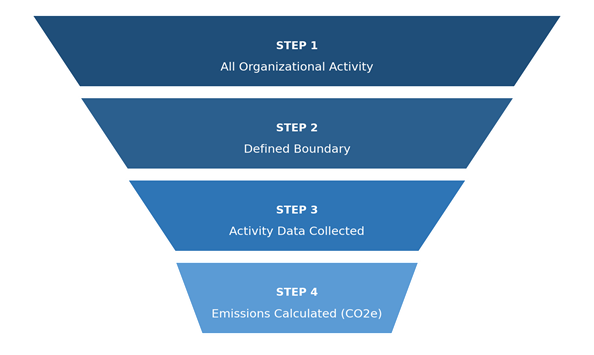
Figure 2: Each step narrows broad organizational activity into a single, comparable emissions figure
1. Define the boundary. A parent company with full ownership of one subsidiary and 30 percent of another must pick between the equity-share and financial-control approach. This one decision sets the scope of everything downstream.
2. Collect activity data. Fuel purchased, kilowatt hours consumed, distance travelled. Most organizations already hold this data; no new infrastructure is needed.
3. Apply an emission factor. A standardized, region-specific conversion figure. Bangladesh’s national grid factor is confirmed at 0.62 tonnes CO2e per MWh by the Department of Environment as of January 2025.4
4. Calculate and aggregate. Activity data multiplied by the emission factor, summed across every activity and scope.
This is the single most consistent finding across corporate emissions data. CDP’s cross-sector analysis puts Scope 3 at an average of 75 percent of total footprint.5 A separate CDP-based study found disclosed Scope 3 footprints run 11.4 times larger than Scope 1 and 2 combined.6
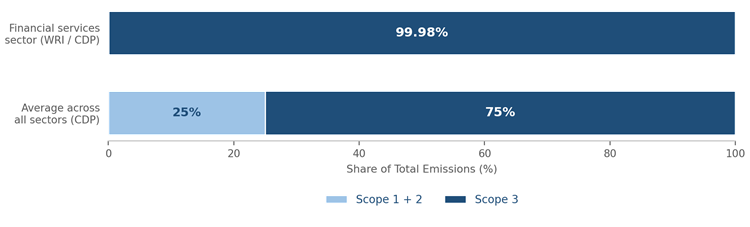
Figure 3: Scope 3 dominance by sector, general cross-sector average versus financial services
In financial services, WRI’s analysis of CDP data puts Scope 3 at 99.98 percent of total emissions on average, meaning a bank’s offices and generators are close to irrelevant next to what it lends against.7
Kilns run on natural gas. Grinding, mixing, and glazing draw a steady electricity load. Two documents cover Scope 1 and 2 in full: the gas bill and the electricity bill.
Step 1: Pull the activity data
Start with what the factory actually consumed in the period. Suppose The gas bill shows 1,850 cubic metres of natural gas burned in the kilns. The electricity bill shows 9 MWh drawn from the grid.
Step 2: Match each activity to the right emission factor
Natural gas burned on-site gets a combustion emission factor: 2.02633 kg CO2e per cubic metre, from the UK Department for Environment, Food and Rural Affairs / Department for Energy Security and Net Zero 2025 GHG Conversion Factors.8 Combustion chemistry doesn’t vary by country the way grid generation does, so this is the standard reference figure used internationally, including in Bangladesh, when no local combustion factor is published.
Grid electricity gets a different kind of factor: 0.62 tonnes CO2e per MWh. This is Bangladesh’s grid emission factor, and it reflects the fuel mix (gas, coal, imported power) the national grid uses to generate electricity. Grid factors are country-specific because the generation mix is country-specific.
Step 3: Multiply activity data by emission factor
Gas: 1,850 m³ × 2.02633 kg CO2e/m³ = 3,748.7 kg CO2e.
Divide by 1,000 to convert to tonnes: 3.75 tCO2e.
Electricity: 9 MWh × 0.62 tCO2e/MWh = 5.58 tCO2e.
No conversion is needed here since the factor is already in tonnes.
Step 4: Assign the right scope
Gas goes to Scope 1 because the factory burns it directly, inside its own kilns. Combustion and emissions happen on-site. The factory owns the source.
Electricity goes to Scope 2 because emissions don’t happen at the factory at all. They happen at the power plant that generates electricity. The factory just consumes output. This is the core distinction between Scope 1 and Scope 2: who burns the fuel, not who uses the energy.
Step 5: Sum for the total
3.75 tCO2e (Scope 1) + 5.58 tCO2e (Scope 2) = 9.33 tCO2e total.
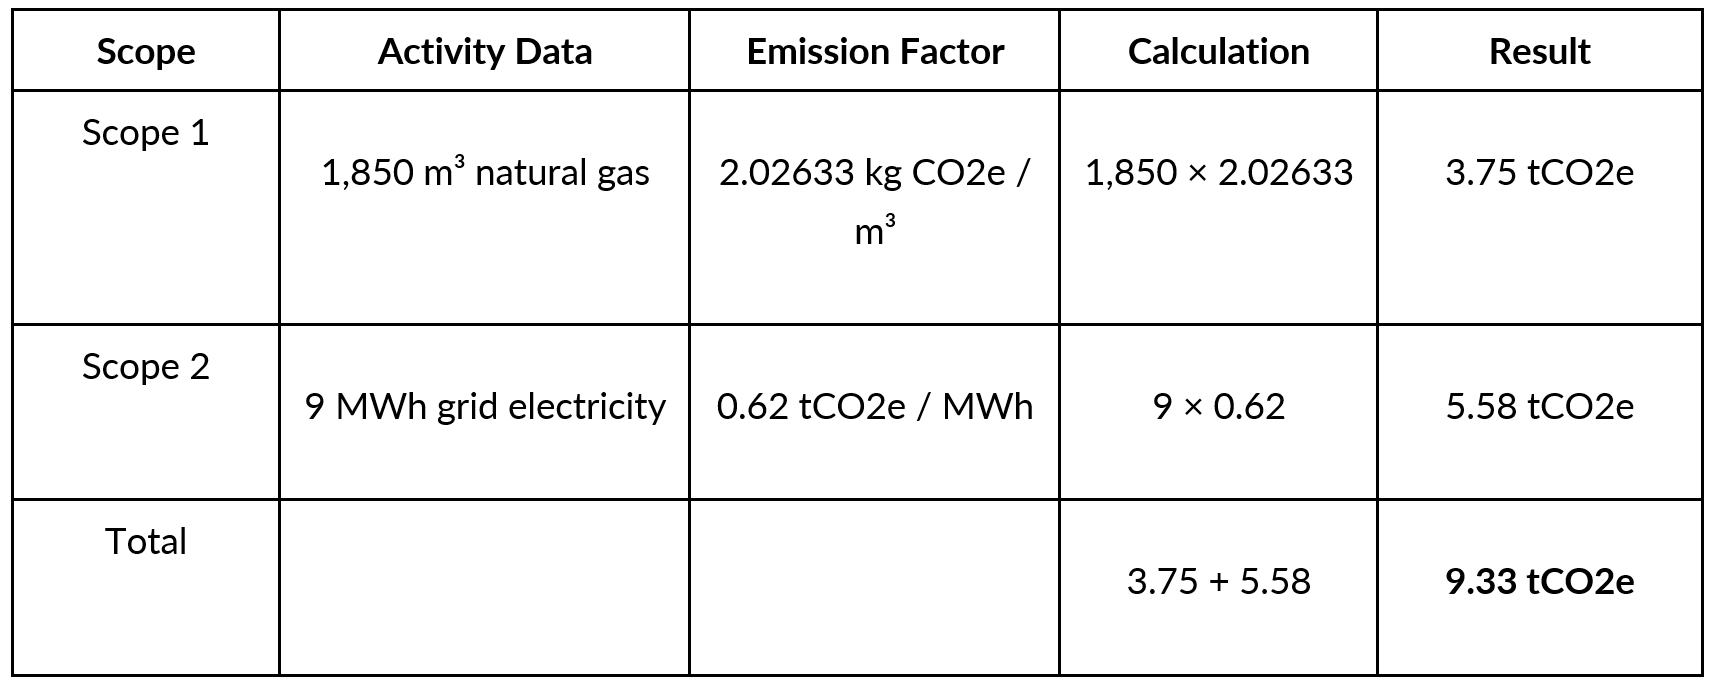
Sources: natural gas combustion factor, UK DEFRA/DESNZ 2025 GHG Conversion Factors; grid electricity factor, Bangladesh Department of Environment.
A Note on Scope 3 for This Factory
Scope 1 and 2 total 9.33 tCO2e a month. That figure excludes the factory’s supply chain: clay and glaze materials, packaging, inbound and outbound freight, and downstream retail and disposal of the tableware. These fall under Scope 3.
For manufacturers, Scope 3 typically exceeds Scope 1 and 2 combined, since raw material extraction and processing carry embedded emissions before the factory receives them. This walkthrough stops at Scope 1 and 2 because those come directly from the factory’s own gas and electricity bills. Scope 3 requires emissions data from suppliers and logistics partners, which most factories haven’t yet collected.
The GHG Protocol is an accounting standard with defined boundaries, verifiable inputs, and standardized factors. Scope 1 and 2 are the easy half. The hard half is Scope 3, and for most organizations it’s also the larger half. For banks, it’s the loan book. For manufacturers, it’s the supply chain. Bangladesh’s regulators are phasing this in by sector. That sequencing buys time to build the systems. The organizations that start measuring Scope 1 and 2 now, while Scope 3 methodology is still catching up, will be the ones with a working number when the deadline arrives instead of a scramble.
This article was authored by Shoumik Shahriar, Principal Business Consultant & Portfolio Manager at LightCastle Partners. For further clarifications, contact here: [email protected]
Our experts can help you solve your unique challenges
Stay up-to-date with our Thought Leadership and Insights