


GET IN TOUCH
- Please wait...

Bangladesh’s cost-of-living challenge lies not only in rising prices, but in whether earnings can keep pace with them. When wages fall behind inflation, the pressure extends beyond the market basket. It affects household choices about food, housing, transport and healthcare. For households with greater financial resources, that pressure may be manageable. However, for middle and lower-income households with limited room in their budgets, routine expenses can become difficult trade-offs. The question, therefore, is not simply how quickly prices are rising, but whose purchasing power is declining.
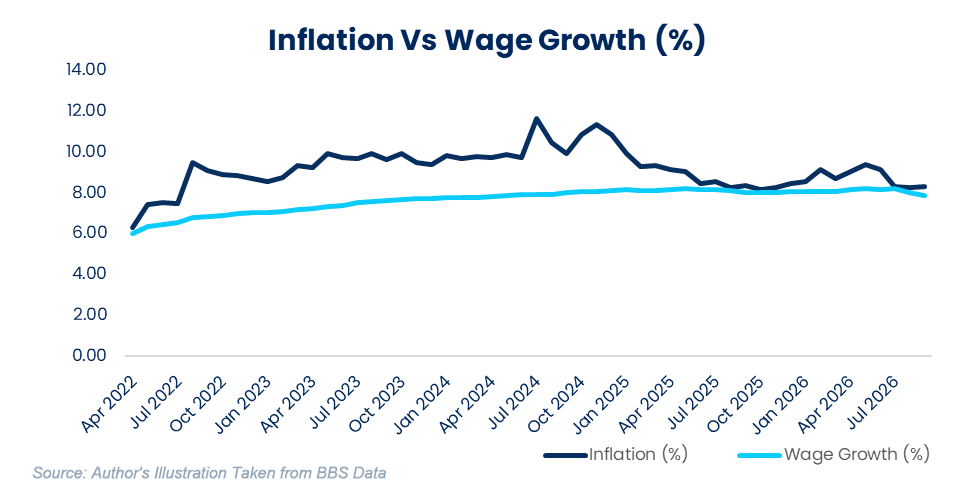
Figure 1: Inflation Vs Wage Growth (%)
Wage-rate increases failed to keep pace with consumer prices from fiscal year (FY) 2021-22 to 2025-26. As a result, higher wages could not translate into greater affordability. This article explores how national averages overlook differences in household affordability. It also examines how pay policies and informality shape protection from rising costs. Finally, it considers how established measures can provide a clearer assessment of whether progress is reaching lower-income households.
A rising national average shows that growth has occurred, not who has captured it. When gains flow mostly to higher-income households, lower-income households are no better placed to meet rising costs. Assessing affordability therefore means looking beyond the average. It begins with examining how much of the country’s income reaches different classes.
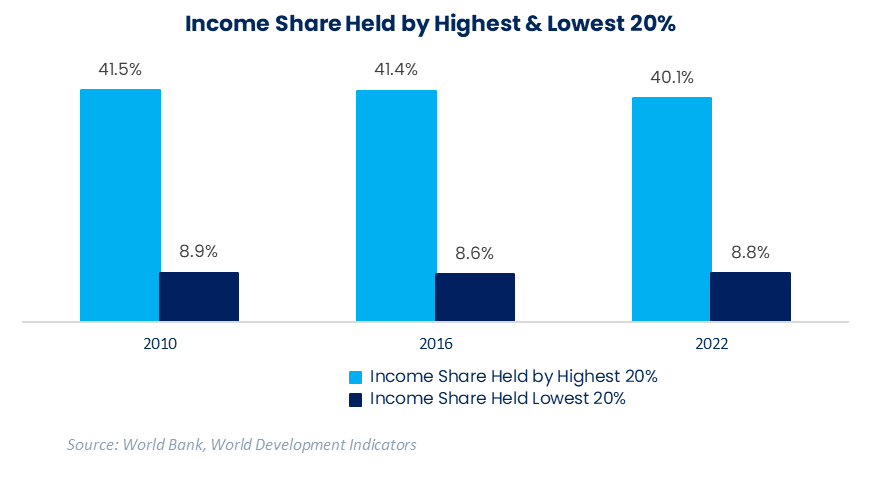
Figure 2: Unequal Shares: Distribution Between Bangladesh’s Richest and Poorest 20% (2010-2022)
Headline inflation can also understate the pressure lower-income households face, since prices rise most on the necessities they rely on. Food takes a much larger share of their budgets. As a result, rising food prices crowd out spending on health, education and transport.[1] During the 2022 price spike, poorer families cut education and medical spending and turned to borrowing.[2] Price exposure measures how much costs rise. However, the consequences depend on whether households can absorb the increase without giving up basic needs.
Affordability therefore depends on both what people need to pay for and the resources they have to pay for it. Whether those resources keep pace with rising costs depends on who has access to earnings adjustments and who does not.
Bangladesh’s public-sector pay decisions and garment-sector minimum-wage revisions portray institutional mechanisms for raising earnings. However, their timing, coverage and implementation determine the relief households receive. Periodic or phased increases may leave earnings lagging behind living costs.
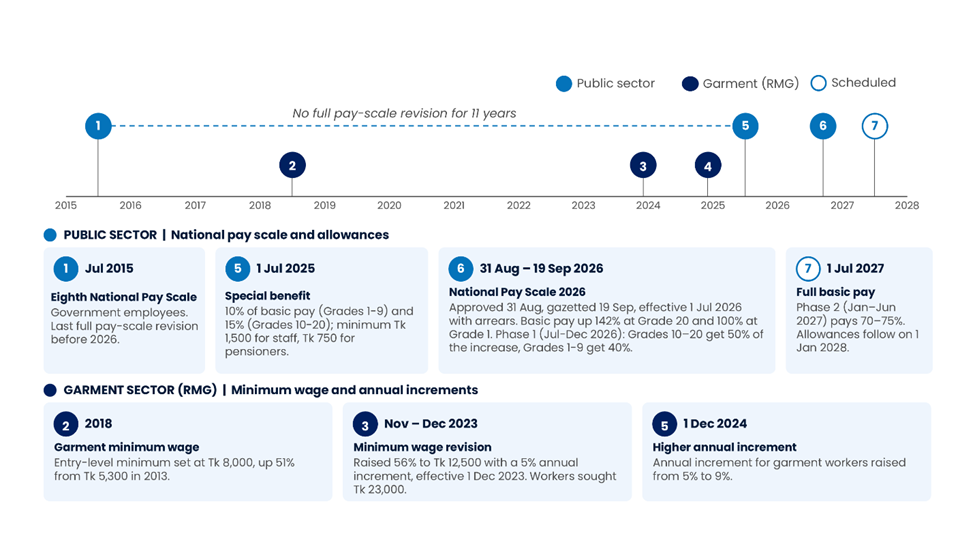
Figure 3: Pay and Wage Adjustments in Bangladesh’s Public and Garment Sectors
Source: Finance Division circulars and gazettes; Ministry of Labour and Employment minimum-wage gazettes.
Public-sector measures reach eligible recipients, while private-sector adjustments depend on contracts, sectoral rules and employers’ capacity to pay. A revision for one workforce therefore cannot establish that purchasing power has recovered across households.
Informality widens this coverage gap. Almost 84% of employed people in Bangladesh worked informally, leaving only around 16% in formal employment.[3] Informal wage workers rely on negotiated rates and available work. Meanwhile, the self-employed must cover rising costs through business earnings. Neither group is assured of an income increase when living costs rise. The concern is uneven protection, making it important to track whose earnings adjust and what those earnings can buy.
Bangladesh already has an official multidimensional poverty framework to measure disadvantages in people’s living conditions beyond income alone. Published by the General Economics Division in 2025, the National MPI uses 11 indicators across health, education and living standards. It identifies overlapping deprivations and shows where they cluster geographically. This provides an important picture of deprivation, but not a current account of household purchasing power. Nor does it show how securely people earn or whether essential needs remain affordable.[4]
A complementary set of measures could connect this picture of deprivation with changing household pressures. Tracking real earnings, essential costs, income distribution and employment conditions alongside MPI would help reveal whose resources are keeping pace. It would also show where affordability is weakening. Several established approaches offer practical ways to examine these pressures.
A more comprehensive picture of household affordability comes from connecting earnings and living costs with the needs they must cover. Established measures offer different ways to examine these pressures. These range from access to adequate food to differences in inflation across income groups and broader living conditions.
Food Affordability and Purchasing Power
BRAC’s Khichuri Index expresses a day’s earnings as the number of family portions of khichuri they can buy. It translates purchasing power into an everyday meal.
Developed during the COVID-19 lockdown, the index compared meal costs with earnings among workers such as agricultural laborers and rickshaw pullers. Later rounds examined differences across occupations, gender and locations.
The index shows how food affordability changes when earnings and prices move apart, particularly for people dependent on daily work. However, it offers a focused view of food purchasing power rather than a complete measure of household living costs.[5]
FAO’s Cost and Affordability of a Healthy Diet indicators extend this assessment to nutritional adequacy. They examine whether people can afford a least-cost healthy diet rather than simply a basic meal. India’s Thalinomics provides a neighbouring example, comparing the cost of a familiar plate of food with industrial workers’ earnings. It illustrates both the accessibility of meal-based measures and the importance of whose earnings they represent.[6][7]
Measuring Inflation Across Income Groups
Brazil’s Ipea publishes inflation estimates for six income groups, showing how different costs affect household budgets. These include food, housing, transport and other expenses. Its income-sensitive approach reveals differences hidden by national averages, without assuming poorer households always face the highest inflation.[8]
Bangladesh already publishes consumer-price and wage indices, while its Household Income and Expenditure Survey records earnings and spending. Following Brazil’s approach, Bangladesh could use household spending patterns to estimate inflation by income group. It could then report these estimates alongside earnings trends and essential-food affordability. Rural-urban and employment-type breakdowns, where feasible, would strengthen the picture.
Beyond Purchasing Power: Assessing Well-being
Affordability matters, but higher earnings alone do not establish that lives are improving. UNDP’s Human Development Index combines health, education and income. Meanwhile, its inequality-adjusted version accounts for how unevenly these achievements are distributed.[9]
The OECD’s well-being framework extends the assessment to housing, job quality, safety and social connections. For Bangladesh, these approaches suggest assessing purchasing power alongside broader living conditions and inequalities. Income growth alone should not be treated as sufficient evidence of progress.[10]
Bangladesh’s economic progress needs to be understood through the experiences of households across the income distribution. Bringing existing indicators together would help show whether growth is improving everyday life. This includes lower-income families whose pressures can be lost in national averages.
Firstly, comparing earnings with the cost of essential needs would show whether households are gaining purchasing power. Looking at food affordability alongside housing, transport and healthcare expenses would reveal whether higher earnings provide relief. It would also show whether rising costs absorb those gains.
Secondly, examining differences across income groups would bring unequal pressures into view. Following Brazil’s approach, Bangladesh could use household spending patterns to estimate inflation for different income groups. It could then compare these estimates with their earnings trends. Including work availability and earnings stability would also help capture the circumstances of informal workers and the self-employed. This would avoid relying solely on pay adjustments that cover only parts of the workforce.
Finally, connecting affordability with broader living conditions would give these financial changes greater meaning. Reading purchasing-power trends alongside Bangladesh’s MPI and indicators of health, education, housing and job quality would help assess economic gains. It would show whether these gains translate into better lives. Keeping financially stretched households above poverty thresholds in the picture would also avoid equating an escape from poverty with lasting financial security.
The article was authored by Tasnuva Jahan Lamiya, Former Trainee Consultant at LightCastle Partners. For further clarifications, contact here: [email protected]
[1] Raihan, S. (2022). Do the official inflation figures in Bangladesh reflect the actual inflation faced by the marginalised households in Bangladesh?. South Asian Network on Economic Modeling (SANEM). Link
[2] Centre for Policy Dialogue (CPD). (2022). High prices and low wages: A time for struggle and compromise. CPD. Link
[3] Bangladesh Bureau of Statistics (BBS).BBS. Link
[4] General Economics Division (GED). (2025). National Multidimensional Poverty Index for Bangladesh. Bangladesh Planning Commission, Government of the People’s Republic of Bangladesh. Link
[5] Morshed, K. A. M., & Saltmarsh, S.-J. (2020). The Khichuri Index: Measuring the economic stress level in Bangladesh. BRAC. Link
[6] Food and Agriculture Organization of the United Nations (FAO). (2025). The cost and affordability of a healthy diet (CoAHD) indicators: Methods and data sources. FAOSTAT. Link
[7] Ministry of Finance, Government of India. (2020). Department of Economic Affairs, Economic Division. Link
[8] Instituto de Pesquisa Econômica Aplicada (Ipea). Inflação por classe social [Indicador Ipea de Inflação por Faixa de Renda]. Carta de Conjuntura, Ipea. Link
[9] United Nations Development Programme (UNDP). Human Development Index (HDI). Human Development Reports, UNDP. Link
[10] Organisation for Economic Co-operation and Development (OECD).Measuring well-being and progress. OECD. Link
Our experts can help you solve your unique challenges
Stay up-to-date with our Thought Leadership and Insights